
Annual Integrated Report for the year ended 30 June 2024
Annual Integrated Report for the year ended 30 June 2024

This is an extract from Implats’ Mineral Resource and Mineral Reserve Statement.
The Mineral Resource and Mineral Reserve Statement as at 30 June 2024 reflects the benefit of the positive long-term pricing outlook for the significant PGMs Implats produces, as well as the capital investment in material projects in the period under review.
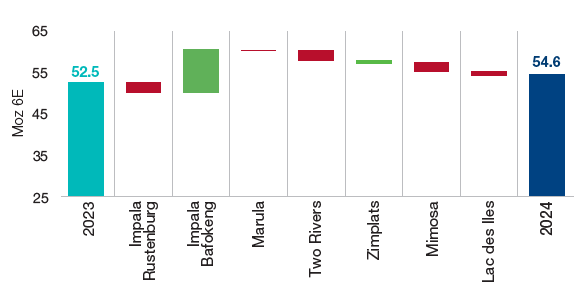
The attributable Group Mineral Resource estimate increased 21% to 316.5Moz 6E, and the attributable Group Mineral Reserve estimate increased 4% to 54.6Moz 6E.
Implats increased by 53.8Moz 6E
Implats increased by 2.2Moz 6E
Greenfields exploration activities remain dormant at the South African, Zimbabwean and Canadian operations. Shaft sinking activities at Impala Rustenburg’s 17 Shaft, Maseve North Shaft and Afplats’ Leeuwkop Shaft remain suspended. The Two Rivers Merensky and Mimosa North Hill projects were excluded from the Mineral Reserves estimate due to unfavourable conditions related to the Reasonable Prospect of Eventual Economic Extraction (RPEE).
The headline summary for the Group is shown below.
| Attributable estimates |
2024 | 2023 | 2022 | 2021 | 2020 | |
| Mineral Resources* | Moz Pt | 156.3 | 127.1 | 128.2 | 132.3 | 132.4 |
|---|---|---|---|---|---|---|
| Moz Pd | 97.4 | 85.4 | 87.7 | 90.2 | 89.9 | |
| Moz 3E | 266.1 | 223.3 | 227.7 | 234.4 | 233.9 | |
| Moz 4E | 284.2 | 237.7 | 242.4 | 249.7 | 249.1 | |
| Moz 6E | 316.5 | 262.7 | 268.6 | 277.3 | 277.1 | |
| Mt | 2 031.4 | 1 800.2 | 1 834.6 | 1 885.9 | 1 818.8 | |
| Mineral Reserves | Moz Pt | 26.3 | 24.3 | 25.5 | 24.6 | 21.8 |
| Moz Pd | 18.0 | 18.4 | 19.7 | 18.8 | 17.3 | |
| Moz 3E | 46.7 | 45.3 | 47.8 | 46.0 | 41.2 | |
| Moz 4E | 49.6 | 48.0 | 50.7 | 48.7 | 43.6 | |
| Moz 6E | 54.6 | 52.5 | 55.7 | 53.4 | 47.8 | |
| Mt | 489.7 | 506.0 | 528.2 | 512.4 | 419.7 |
* Mineral Resource estimate is inclusive of Mineral Reserves.
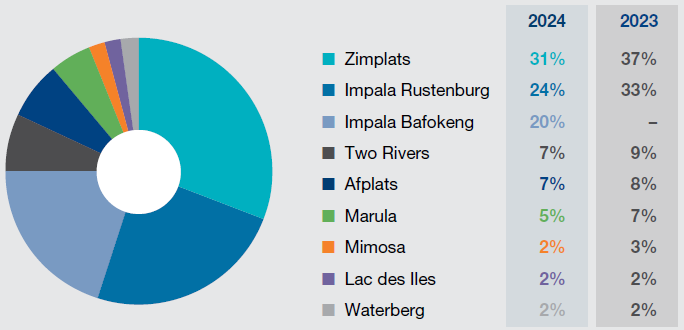
Overall, the attributable Group Mineral Resource estimate increased by 53.8Moz 6E to 316.5Moz 6E. Zimplats accounts for 31% of the Group’s Mineral Resource base, Impala Rustenburg accounts for 24%, and the balance of 45% comprises Impala Bafokeng, Marula, Mimosa, Two Rivers, Lac des Iles, Waterberg and Afplats. The inclusion of Impala Bafokeng accounts for 20% of the total attributable Mineral Resource base.
Attributable Mineral Resource estimate
as at 30 June 2024 (variance Moz 6E)

Overall, the attributable Group Mineral Reserve estimate increased by 2.2Moz 6E to 54.6Moz 6E. Zimplats accounts for 42% of the attributable 6E Mineral Reserve estimate base and Impala Rustenburg accounts for 21%. The inclusion of Impala Bafokeng accounts for 19% of the total attributable Mineral Reserve base.
Attributable Mineral Reserve estimate
as at 30 June 2024 (variance Moz 6E)
ATTRIBUTABLE GROUP MINERAL RESOURCES
increased by 53.8 million 6E ounces to 316.5 million 6E ounces
↑ATTRIBUTABLE GROUP MINERAL RESERVES
increased by 2.2 million 6E ounces to 54.6 million 6E ounces
↑| Attributable estimates | 2024 | 2023 |
| Merchanised | 64% | 65% |
|---|---|---|
| Hybrid | 9% | 9% |
| Conventional | 27% | 26% |
| Pt | Pd | Rh | Ru, Ir, Au |
|
| South Africa | 57% | 45% | 68% | 59% |
|---|---|---|---|---|
| Zimbabwe | 43% | 50% | 32% | 40% |
| Canada | 0% | 5% | 0% | 1% |
Attributable Mineral Resource estimate of 316.5Moz 6E
as at 30 June 2024 (%)
Attributable Mineral Reserve estimate of 54.6Moz 6E
as at 30 June 2024 (%)


Implats uses a discounted cash flow model that embodies economic, financial and production estimates in the valuation of mineral assets. The outputs are a net present value, an internal rate of return, annual free cash flow, project payback period and funding requirements. Implats’ marketing and finance departments regularly update metal price and exchange rate forecasts. As at 30 June 2024, the Group used a real long-term forecast of R27 359 (US$1 670) for the 6E basket revenue per 6E ounce sold.
Reporting Mineral Resources and Mineral Reserves for Implats’ South African, Zimbabwean and Canadian operations is undertaken in accordance with the principles and guidelines of the SAMREC Code (2016), and section 12.13 of the JSE Listings Requirements. Additional detail is provided on page 21 of the Mineral Resource and Mineral Reserve Statement.
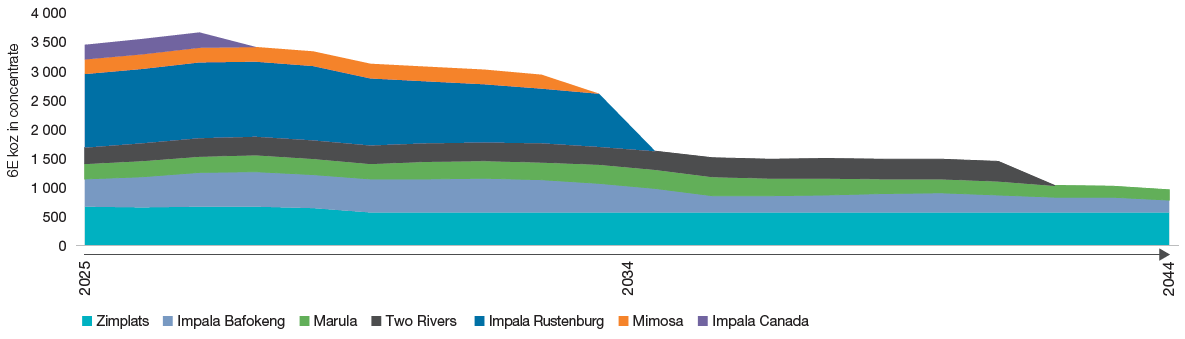
The graph to the right shows the consolidated high-level LoM I plans collated from the individual profiles per operation. The profiles represent the Mineral Reserve estimates as at 30 June 2024 and reflect the current infrastructure. All LoM I profiles were subjected to economic testing and unprofitable production was excluded and classified as LoM IA. This is referred to as tail-cutting. No Inferred Mineral Resources are included in the LoM I and Mineral Reserve estimates, other than minor incidental dilution in isolated cases, which is included at zero grade.
Implats estimated 20-year 6E LoM I ounce profile
as at 30 June 2024
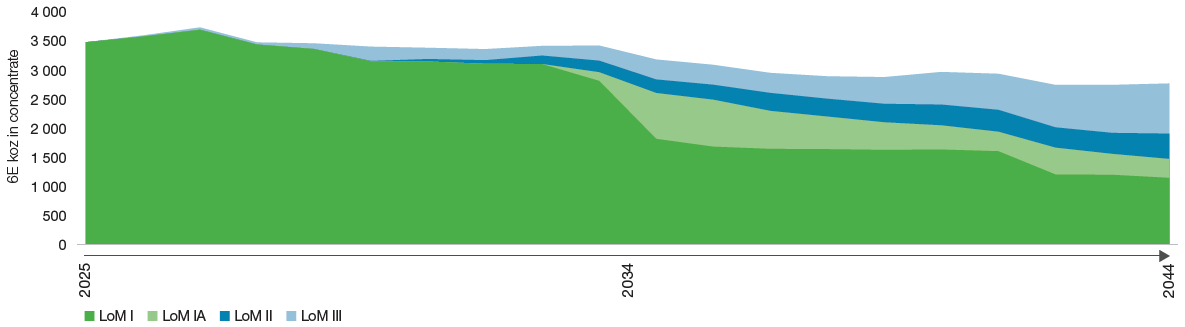
It is clear from a combined Group perspective that a proportion of the 20-year LoM plan is still at levels II and III and would require an improved financial outlook, further studies, funding and capital approval by the board. Feasibility studies are continuing at Impala Rustenburg, Impala Bafokeng, Two Rivers, Zimplats, Marula, Lac des Iles, Mimosa and the Waterberg project to evaluate future opportunities.
Implats' estimated 20-year 6E LoM I, IA, II and III ounce profile
as at 30 June 2024
Implats is committed to an increased strategic thrust to evaluate LoM scenarios and options to optimise current infrastructure and Mineral Resources. This relates to the Group’s brownfields opportunities, but does not exclude mergers or new acquisitions.