
 Integrated
 Mineral resource
 Sustainable
 Implats Annual

Management Processes
Remuneration linked to strategy
Remuneration overview
| Remuneration mix (elements) |
Employee categories | ||||
| Management and executives | Collective bargaining categories | ||||
| Executive management | Senior management |
Middle management |
A, B and C band | ||
| F band | E band | D band | |||
| Guaranteed remuneration | Basic salary | Increase based on:
|
Increase based on:
|
||
| Benefits |
|
||||
| Allowances |
|
||||
| Variable remuneration | Short-term incentives (STI) | Annual STI
|
Monthly and quarterly STI
|
||
| Long-term incentives (LTI) | Not applicable | CSP no performance targets | Not applicable | ||
| Conditional Share Plan (CSP) – performance targets | Not applicable | ||||
| Share Appreciation Rights | Not applicable | Not applicable | |||
| Not applicable | Employee Share Ownership Plan | ||||
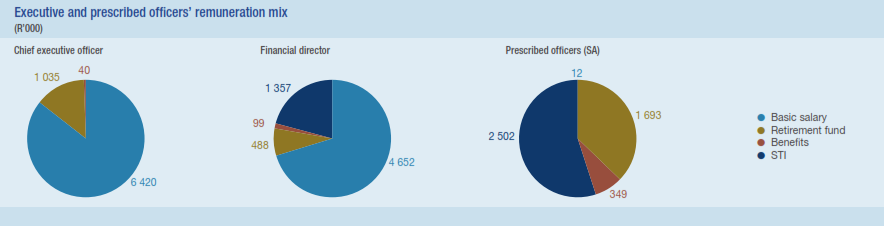
Management remuneration
Management and executive employees are remunerated on a guaranteed package basis. These packages and increases to or adjustments thereof are based on the following principles:
- Remuneration is based on individual performance. This is measured through our performance management system where key performance indicators (KPIs) are contracted and assessed.
- External competitiveness is benchmarked in accordance with our remuneration strategy against the 50th percentile of the market for most employees and against the 75th percentile of the market for high level performers, HDSA employees and critical skills.
- Internal equity is achieved through internal benchmarks taking into account variation due to circumstantial allowances and performance.
- Affordability is determined prior to recommendation to the remuneration committee of the board for approval.
Total remuneration is informed by the strategic elements listed below:
| Key performance indicators | Chief executive officer (%) |
Financial director (%) |
Senior executives (%) |
Other executives (%) |
|
| Vision and strategy
Sustainability Leadership and people Stakeholder engagement |
35.0 | 45.0 | 59.0 | 64.0 | |
| Operational excellence | 14.0 | 7.5 | 5.6 | 6.4 | |
| Safety, health, environment and community | 19.0 | 12.5 | 9.8 | 9.7 | |
| Individual projects | 7.0 | 10.0 | 4.8 | 3.2 | |
| Total shareholder return | 20.0 | 20.0 | 16.7 | 13.3 | |
| EBITDA | 5.0 | 5.0 | 4.2 | 3.3 | |
| 100.0 | 100.0 | 100.0 | 100.0 |
