Integrated Annual Report 2014
Menu
Integrated Annual Report 2014
Menu
 Integrated Annual Report 2014
Menu
Integrated Annual Report 2014
Menu

 Group production deteriorated from 1.582 million ounces of platinum to 1.178 million ounces due to industrial action at the Impala Rustenburg operations
The financial review is intended to assist the reader in understanding Implats' financial performance and the significant variances compared to the prior year. The review should be read in conjunction with the audited consolidated financial statements for the year ended 30 June 2014 as available on the website and the non-GAAP financial performance measures.
| ('000oz) | 2014 | 2013 |
| Impala | 411 | 709 |
| Zimplats | 226 | 180 |
| Marula | 77 | 71 |
| Mimosa (100%) | 103 | 97 |
| Two Rivers (100%) | 168 | 157 |
| Offtake contracts | 32 | 138 |
| Other: | ||
| Autocatalyst recycling | 4 | 114 |
| Once-off toll treatment | 157 | 116 |
| Total production | 1 178 | 1 582 |
The individual operation reviews, set out here, should be read for a full appreciation of the changes in production. Set out below are the salient features of the managed operations.
Ore milled decreased by 43.3% to 6.2 million tonnes while refined platinum decreased by 42.0% to 411 000 ounces on the back of the five-month industrial action which resulted in a loss of approximately 312 000 platinum ounces.
Ore milled increased by 26.8% to 5.9 million tonnes and platinum in matte increased by 21.0% to 239 700 ounces due to the ramp-up of the Phase 2 expansion.
Ore milled increased by 10.2% to 1.8 million tonnes due to additional production teams and platinum in concentrate increased by 9.5% to 78 500 ounces largely in line with the increase in milled tonnage.
The abridged statement of comprehensive income is presented below with an analysis of material variances thereafter. The adoption of IFRS10 and IFRS11 resulted in the restatement of the consolidated financial statements for the prior year with the impact of the changes being available in the annual financial statements.
| 2014 Rm |
2013 Rm |
|
| Revenue | 29 028 | 29 844 |
| Cost of sales | (25 786) | (25 132) |
| Gross profit | 3 242 | 4 712 |
| Impairment | (1 071) | (2 279) |
| Net finance (expense)/income | (178) | (224) |
| Other net (expense)/income | (1 978) | 251 |
| Profit before tax | 15 | 2 460 |
| Income tax expense | (144) | (1 392) |
| Profit/(loss) for the year | (129) | 1 068 |
| Headline earning per share (cents) | 86 | 329 |
| Dividends per share (cents) | – | 95 |
The reduction in revenue of R816 million is attributable to the following:
A negative volume variance of R3.34 billion mainly due to the industrial action at Impala
Lower sales volumes of platinum (R1.86 billion), palladium (R549 million), rhodium (R293 million) and nickel (R360 million) as a result of lower production volumes partially offset by a drawdown of refined stocks at Impala.
Lower dollar metal prices gave rise to a negative variance of R1.76 billion
The average dollar revenue per platinum ounce sold of US$2 299 was US$206 or 8.2% lower than 2013. The average prices achieved for platinum, rhodium and nickel were 8.3% (R1.35 billion), 12.5% (R184 million), and 11.5% (R179 million) lower, respectively. The price of palladium was up by 9.0% (R415 million).
A weaker rand/dollar exchange rate contributed a positive variance of R4.28 billion
The average rand/dollar exchange rate achieved of R10.36 to the dollar, was 17.6% weaker than the R8.81 per dollar achieved during the prior year. Consequently, although the dollar revenue per platinum ounce decreased by 8.2%, the rand revenue per platinum ounce increased by 7.9%.
Of the total platinum, palladium and rhodium refined by the Group, 744 000 ounces (or 35%) were sold to customers who use the metals to manufacture autocatalysts. Twenty-two percent of platinum, palladium and rhodium sales were sold to South African customers for further beneficiation.
Cost of sales rose by R654 million to R25.79 billion and the material variances on the prior year are set out below.
Decreases
Increases
Implats has a procurement policy based on granting preferential status to suppliers identified and accredited as being BEE suppliers (>25% black shareholding). Included in the cost of sales is a total discretionary spend of R5.5 billion of which 72% was spent with accredited BEE suppliers (2013: R6.4 billion or 64%).
Revenues reduced by only R816 million to R29.03 billion mainly assisted by destocking and higher rand metal prices| Mining Charter target 2014 % |
Actual 2014 % |
Actual 2013 % |
|
| Consumables | 50 | 72 | 64 |
| Services | 70 | 72 | 60 |
| * | Discretionary procurement is defined as total procurement less procurement from public sector vendors (for example rates and taxes), utility service providers (for example electricity), pass through payments (for example medical and pension) and sponsorships. |
The cash cost per platinum ounce produced by the Group increased by 17.6% from R16 526 to R19 430 per platinum ounce. The increase was mainly attributable to the inflationary increases and ‘change in metal inventories' variances (as referred to above in the ‘cost of sales' analysis) and the lower production volumes from Impala. On a normalised basis, adjusting for the savings in operational costs and the 312 000 ounces of lost platinum production, unit costs would have been R17 308, an increase of 5% on the prior year.
Gross profit was down by R1.47 billion to R3.24 billion and the gross profit margin declined from 15.8% to 11.2%. The table below sets out the contribution of each business segment to the gross profit and the associated gross profit percentage.
| Gross profit Rm |
Gross profit margin % |
|||
| 2014 | 2013 | 2014 | 2013 | |
| Impala | (1 902) | 2 097 | (18.4) | 14.4 |
| Zimplats | 2 039 | 1 451 | 34.1 | 34.9 |
| Marula | (12) | (216) | (0.7) | (15.4) |
| Afplats | (5) | (2) | – | – |
| IRS | 1 813 | 1 397 | 9.2 | 9.6 |
| Chrome processing | 41 | 38 | 22.9 | 21.0 |
| Intersegment adjustment | 1 268 | (53) | ||
| Implats Group | 3 242 | 4 712 | 11.2 | 15.8 |
The impairment charge of R1 071 million relates in the main to:
Net interest expense was R46 million lower at R178 (2013: R224) million as a result of:
Profit before tax declined from R2.5 billion to R15 million. All other material items (not already covered) affecting the profit before tax are:
The tax charge decreased by R1.25 billion mainly due to lower taxable profits in the Group. Disallowable expenditure for tax purposes increased the tax payable by R175 million, which given the absolute size of the amounts contributes significantly to the effective tax rate of 960% (2013: 56.6%). In 2013, the high effective rate was due primarily to the non-deductibility of the impairments in that year.
Headline earnings decreased by 73.9% from 329 cents per share to 86 cents per share. The table below sets out each company's contribution to headline earnings.
| 2014 | 2013 | |||
| Rm | % | Rm | % | |
| Impala | (1 374) | (231.3) | 1 650 | 50.0 |
| Zimplats | 785 | 132.1 | 533 | 16.2 |
| Marula | (185) | (31.1) | (297) | (9.0) |
| Mimosa | 82 | 13.8 | 120 | 3.6 |
| Two Rivers | 273 | 46.0 | 156 | 4.7 |
| IRS | 1 138 | 191.6 | 1 031 | 31.2 |
| Impala Chrome | 25 | 4.2 | 19 | 0.6 |
| Investment and other | (150) | (25.3) | 88 | 2.7 |
| Normalised earnings | 594 | 100.0 | 3 300 | 100.0 |
| Impairments | (71) | (1 306) | ||
| Headline earnings | 523 | 1 994 | ||
| Headline earnings (cents per share) | 86 | 329 | ||
Gross profit was down by R1.47 billion to R3.24 billion and the gross profit margin declined from 15.8% to 11.2%Given the length of the industrial action at Impala and as part of its continued cash preservation strategy, the board has resolved not to declare a final dividend for the year to 30 June 2014.
During the first half of the year under review, the Group continued to invest in maintaining and expanding its operations to secure its production profile in the future. A total of R1.92 billion was spent on 20, 16 and 17 Shafts, which are critical to grow and then maintain production. All of the Impala capital projects were affected by the five-month industrial action, which halted all activities at 20 and 16 Shafts. At 17 Shaft, execution of sinking and station development by the contractors continued during the strike period. However, ore reserve development activities did not commence in an effort to preserve cash.
At Zimplats, R668 million was spent on the Phase 2 expansion project, which will grow production to 270 000 ounces of platinum from this company.
| 2014 Rm |
2013 Rm |
|
| Impala | 2 823 | 4 390 |
| Zimplats | 1 225 | 1 449 |
| Marula | 159 | 125 |
| Afplats | 175 | 215 |
| Impala Chrome | 2 | 79 |
| Implats Group | 4 384 | 6 258 |
The total spend of R4.4 billion is below the estimate for 2014 as reported in the 2013 integrated annual report mainly due to the industrial action and the cash preservation strategies that were followed. In line with the focus on cash conservation in the short to medium term, the revised estimate for 2015 of R5.3 billion has been reduced substantially from the previous estimate for 2014. The spend over the next period will, in the main, be funded from the cash raised from the convertible bond.
As with the procurement of consumables and services, the Group has a policy of granting preferential status to HDSA/BEE suppliers of capital goods.
| % | Mining Charter target 2014 |
Actual 2014 |
Actual 2013 |
| Capital | 40 | 48 | 42 |
The Group also promotes procuring capital equipment, consumables and services from vendors surrounding the areas of operations (local procurement). In 2014, total local procurement amounts to R2.0 billion or 26% of total spend (2013: 24%)
An abridged cash flow statement and commentary on material items is set out below:
| 2014 Rm |
2013 Rm |
|
| Cash generated from operating activities | 4 096 | 5 582 |
| Cash flows from investing activities | (3 537) | (5 772) |
| Cash flow from financing activities | (379) | 3 962 |
| Net cash generated | 180 | 3 772 |
| Opening balance | 4 113 | 329 |
| Exchange rate adjustment – cash translation | 12 | 12 |
| Closing balance | 4 305 | 4 113 |
| Debt | (6 405) | (6 082) |
| Sub-total | (2 100) | (1 969) |
| Finance leases | (1 382) | (1 397) |
| Debt net of cash | (3 482) | (3 366) |
Profit before tax was R15 million and income taxes of R714 million were paid. A positive adjustment was made to profit before tax for non-cash items of R3.59 billion. The two largest items were an add-back of depreciation (R2.34 billion) and impairments (R1.07 billion). Cash released due to decreased working capital amounted to R1.65 billion in 2014. Working capital will have to be restored to normal levels once the Impala operation is back at steady state production.
Net cash used in investing activities was R3.54 billion, which was mainly as a result of the capital spend of R4.5 billion offset by dividends received (R467 million), finance income (R319 million) and proceeds from sale of property, plant and equipment (R64 million).
Net cash used in financing activities was mainly the R371 million payment of the final dividend for 2013.
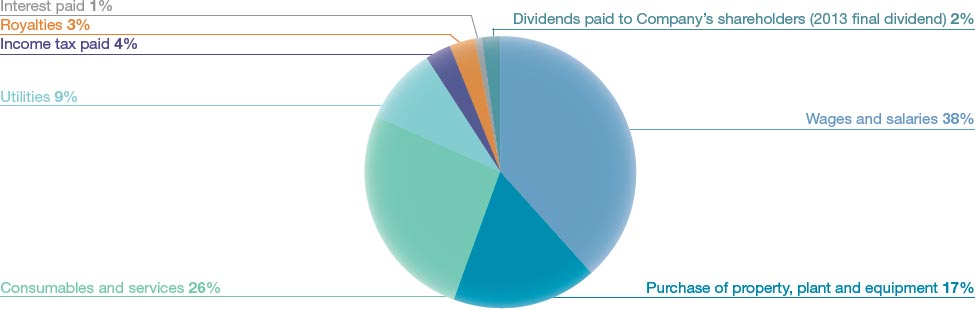
Of the total revenue realised of R29.0 billion, R8.6 billion was used to fund metals purchases and R21.0 billion was deployed as illustrated in the chart below. Monies generated mainly from movements in working capital left the overall cash generated for the period at R180 million.
Total debt of R6.4 (2013: R6.1) billion comprised:
The net results of Implats' operating, investing and financing activities, combined with the opening cash and debt positions, was to end the year with cash of R4.31 billion and net debt (excluding finance leases) of R2.10 billion. In addition to the cash on hand, the Group had committed undrawn facilities of R3.0 billion at year end.
Brenda Berlin
Financial director