 Integrated Annual Report 2014
Menu
Integrated Annual Report 2014
Menu
 Integrated Annual Report 2014
Menu
Integrated Annual Report 2014
Menu
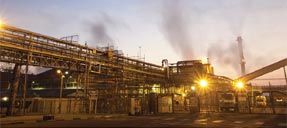 Mimosa had another good year as production remained consistent with steady-state throughput

Mimosa had another good year as production remained consistent with steady-state throughput.
The lost-time injury frequency rate deteriorated from 0.26 million man-hours worked in 2013 to 0.38 in 2014. However, it remains a strong performance.
Tonnes milled improved by 3% compared to the previous year to 2.5 million mainly as a result of a 5% improvement in fleet productivities. Both head grade and concentrator recoveries were maintained at 3.92g/t and 77.3% respectively. The operation produced 110 200 ounces of platinum in concentrate, marginally higher than the previous year.
Unit costs decreased by 4% from US$1 782 per platinum ounce in concentrate to US$1 713. In rand terms unit costs increased by 13% to R17 768 as a result of the higher dollar cost and weaker rand/dollar exchange rate.
Discussions with the Government of Zimbabwe with respect to the proposed indigenisation implementation plan are ongoing.
Production at Mimosa over the medium term will be determined by the exploitation of the South Hill ore resource through the Wedza Shaft and the existing plant. It is expected that steady-state platinum in concentrate production will be maintained at around 100 000 ounces per annum.
| 2014 | 2013 | 2012 | 2011 | 2010 | ||
| Safety leading indicators | ||||||
| Hazards for which internal STOP Notes have been issued (no) | 797 | 742 | 550 | 282 | – | |
| Stoppage/Instructions issued by State or DMR | (no) | 0 | 0 | 0 | 0 | – |
| Leadership STOP Observations | (no) | 20 491 | 16 282 | 9 705 | – | – |
| Safety representative training | (no) | 63 | 44 | 26 | 32 | 37 |
| Safety lagging indicators | ||||||
| Fatal injury frequency rate | (pmmhw) | 0.000 | 0.000 | 0.000 | 0.000 | 0.100 |
| Lost-time injury frequency rate | (pmmhw) | 0.38 | 0.26 | 1.19 | 0.20 | 0.35 |
| Total injury frequency rate | (pmmhw) | 1.62 | 2.83 | 4.65 | 5.70 | 3.74 |
| Lost days rate | (pmmhw) | 32 | 3 | 10 | 3 | 6 |
| Health | ||||||
| Noise-induced hearing loss cases submitted | (no) | 0 | 0 | 0 | 1 | 1 |
| On wellness programme | (no) | 148 | 166 | 197 | 171 | 131 |
| On anti-retroviral therapy | (no) | 152 | 151 | 139 | 123 | 90 |
| Environmental | ||||||
| Total water consumed | (Mℓ) | 3 313 | 3 336 | 3 263 | 3 697 | 4 063 |
| Total water recycled | (%) | 34 | 30 | 35 | 37 | 35 |
| Total CO2 emissions | ('000tpa) | 117 | 171 | 162 | 174 | 166 |
| People | ||||||
| Own employees | (no) | 1 422 | 1 552 | 1 572 | 1 567 | 1 576 |
| Contractors | (no) | 128 | 130 | 199 | 229 | 226 |
| Literacy (ABET level (III)) | (%) | 99 | 99 | 99 | 96 | 96 |
| Labour turnover | (%) | 9 | 4 | 4 | 3 | 6 |
| Social | ||||||
| Community spend | (Rm) | 50 | 41 | 26 | 20 | 3 |
| Sales | (Rm) | 2 970 | 2 579 | 2 403 | 2 569 | 2 063 |
| Platinum | 1 486 | 1 323 | 1 207 | 1 277 | 1 109 | |
| Palladium | 602 | 434 | 392 | 377 | 217 | |
| Rhodium | 78 | 70 | 86 | 128 | 114 | |
| Nickel | 442 | 399 | 403 | 495 | 390 | |
| Other | 362 | 353 | 315 | 292 | 233 | |
| Cost of sales | (Rm) | (2 398) | (1 956) | (1 498) | (1 229) | (1 137) |
| On-mine operations | (1 425) | (1 110) | (813) | (730) | (665) | |
| Processing operations | (375) | (311) | (242) | (196) | (183) | |
| Selling and administration | (158) | (155) | (138) | (90) | (65) | |
| Treatment charges | (200) | (167) | (134) | (118) | (114) | |
| Depreciation | (259) | (220) | (155) | (114) | (80) | |
| Change in metal inventories | 19 | 7 | (16) | 19 | (30) | |
| Gross profit | (Rm) | 572 | 623 | 905 | 1 340 | 926 |
| Royalty expense | (Rm) | (193) | (180) | (131) | (87) | (47) |
| Gross margin | (%) | 19.3 | 24.2 | 37.7 | 52.2 | 44.9 |
| Profit/(loss) for the year | (Rm) | 96 | 100 | 404 | 836 | 472 |
| 50% attributable to Implats | (Rm) | 48 | 50 | 202 | 418 | 236 |
| Intercompany adjustment* | (Rm) | 34 | 20 | 20 | (18) | (56) |
| Share of profit in Implats Group | (Rm) | 82 | 70 | 222 | 400 | 180 |
| Sales volumes in concentrate | ||||||
| Platinum | ('000oz) | 107.6 | 99.2 | 105.2 | 105.4 | 98.4 |
| Palladium | ('000oz) | 85.1 | 78.4 | 81.7 | 81.6 | 75.5 |
| Rhodium | ('000oz) | 9.1 | 8.4 | 8.4 | 8.4 | 7.8 |
| Nickel | (t) | 3 263 | 3 164 | 3 012 | 3 037 | 2 819 |
| Prices achieved in concentrate | ||||||
| Platinum | (US$/oz) | 1 332 | 1 513 | 1 481 | 1 722 | 1 491 |
| Palladium | (US$/oz) | 683 | 628 | 620 | 657 | 380 |
| Rhodium | (US$/oz) | 824 | 944 | 1 325 | 2 161 | 1 935 |
| Nickel | (US$/t) | 13 073 | 14 300 | 17 262 | 23 178 | 18 311 |
| Exchange rate achieved | (R/US$) | 10.37 | 8.82 | 7.74 | 7.03 | 7.56 |
| Production | ||||||
| Tonnes milled ex-mine | ('000t) | 2 453 | 2 381 | 2 324 | 2 311 | 2 277 |
| Headgrade (6E) | (g/t) | 3.92 | 3.95 | 3.93 | 3.91 | 3.86 |
| Platinum in concentrate | ('000oz) | 110.2 | 100.3 | 106.0 | 104.9 | 101.2 |
| Palladium in concentrate | ('000oz) | 87.0 | 79.5 | 82.3 | 80.4 | 76.6 |
| Rhodium in concentrate | ('000oz) | 9.3 | 8.7 | 8.5 | 8.4 | 8.1 |
| Nickel in concentrate | (t) | 3 329 | 3 161 | 3 046 | 2 945 | 2 776 |
| PGM in concentrate | ('000oz) | 234.6 | 214.8 | 222.8 | 219.7 | 210.3 |
| Cost | ||||||
| Total cost | (Rm) | 1 958 | 1 576 | 1 193 | 1 016 | 913 |
| (US$m) | 189 | 179 | 154 | 144 | 121 | |
| Cost per tonne milled | (R/t) | 798 | 662 | 513 | 440 | 401 |
| (US$/t) | 77 | 75 | 66 | 63 | 53 | |
| Cost per PGM ounce in concentrate | (R/oz) | 8 346 | 7 337 | 5 355 | 4 624 | 4 341 |
| (US$/oz) | 805 | 832 | 692 | 658 | 575 | |
| Cost per platinum ounce in concentrate | (R/oz) | 17 768 | 15 713 | 11 255 | 9 685 | 9 018 |
| (US$/oz) | 1 713 | 1 782 | 1 453 | 1 377 | 1 194 | |
| Cost net of revenue received for other metals | (R/oz) | 4 301 | 3 190 | (28) | (2 631) | (405) |
| (US$/oz) | 415 | 362 | (4) | (374) | (54) | |
| Capital expenditure | (Rm) | 298 | 265 | 497 | 372 | 255 |
| (US$m) | 29 | 30 | 64 | 53 | 34 | |
| Labour efficiency | ||||||
| Tonnes milled per employee costed** | (t/man/annum) | 1 500 | 1 372 | 1 381 | 1 319 | 1 287 |
| * | Adjustment note: The adjustment relates to sales from Mimosa to the Implats Group which at year end were still in the pipeline. | ||||||
| ** | Total employees excluding capital project employees. | ||||||