 Integrated Annual Report 2014
Menu
Integrated Annual Report 2014
Menu
 Integrated Annual Report 2014
Menu
Integrated Annual Report 2014
Menu
 In the short term, mine-to-market production will continue to grow as the ramp-up of the Zimplats Phase 2 expansion
Platinum production from mine-to-market operations increased by 14% from the previous year to 575 000 (2013: 505 000) ounces, mainly due to the ramp-up of the Phase 2 expansion project at Zimplats.
Third-party purchases, recycling and toll volumes reduced by 48% to 192 000 ounces despite the increase in the treatment of material for Northam and Platmin. Performance was largely impacted by the termination of the autocatalyst recycling contract and the suspension of deliveries from Everest South, Crocodile River and Smokey Hills operations, which were placed on care and maintenance due to the prevailing market conditions.
| ('000oz) | 2014 | 2013 |
| Zimplats | 226.3 | 180.2 |
| Marula | 76.8 | 70.6 |
| Mimosa | 103.3 | 97.2 |
| Two Rivers | 168.3 | 157.2 |
| Mine-to-market operations | 574.7 | 505.2 |
| Third-party purchases, recycling and toll | 192.3 | 367.1 |
| Grand total | 767.0 | 872.3 |
Gross platinum refined (including Impala production) was 25.5% lower at 1 178 000 (2013: 1 581 500) ounces. Costs at the refineries were well contained at a 6.5% decrease year-on-year. However, unit costs increased to R747 (2013: R595) per platinum ounce due to the 403 500 ounce decline in throughput.
In the short term, mine-to-market production will decline mainly as the volumes from Zimplats is expected to reduce due to the temporary closure of Bimha mine. The resumption of non-managed, currently suspended operations will continue to be determined by market conditions and the economic circumstances of the respective operators. Despite this uncertainty, IRS continues to have access to spare smelting and refining capacity from Impala and remains well placed to process additional material from new customers. Opportunities in this regard are evaluated on an ongoing basis.
| 2014 | 2013 | 2012 | 2011 | 2010 | ||
| Sales | (Rm) | 18 495 | 14 696 | 14 069 | 14 273 | 11 069 |
| Platinum | 10 389 | 8 481 | 7 982 | 8 104 | 6 661 | |
| Palladium | 4 035 | 2 675 | 2 464 | 2 169 | 1 227 | |
| Rhodium | 959 | 794 | 1 113 | 1 376 | 1 242 | |
| Nickel | 1 390 | 1 164 | 1 236 | 1 305 | 1 024 | |
| Other | 1 722 | 1 582 | 1 274 | 1 319 | 915 | |
| Cost of sales | (Rm) | (16 794) | (13 287) | (12 730) | (12 860) | (9 910) |
| Metals purchased | (16 665) | (12 926) | (12 147) | (12 649) | (10 470) | |
| Smelting | (308) | (297) | (225) | (232) | (190) | |
| Refining | (450) | (399) | (378) | (366) | (318) | |
| Selling and administration | (31) | (37) | (37) | (30) | (29) | |
| Increase/(decrease) in metal inventories | 660 | 372 | 57 | 417 | 1 097 | |
| Gross profit IRS | (Rm) | 1 701 | 1 409 | 1 339 | 1 413 | 1 159 |
| Metals purchased – adjustment on metal prices and exchange rates* (Rm) | 244 | 177 | (195) | (20) | – | |
| Inventory – adjustment for metal prices and exchange rates | (Rm) | (132) | (189) | 191 | (4) | – |
| Gross profit in Implats Group | (Rm) | 1 813 | 1 397 | 1 335 | 1 389 | 1 159 |
| Gross margin | (%) | 9.2 | 9.6 | 9.5 | 9.9 | 10.5 |
| Revenue | (Rm) | 18 495 | 14 696 | 14 069 | 14 273 | 11 069 |
| Direct sales to customers | 34 | 111 | 116 | 401 | 383 | |
| Sales to Impala | 17 935 | 14 139 | 13 702 | 13 427 | 10 354 | |
| Treatment income – external | 521 | 442 | 248 | 442 | 330 | |
| Treatment income – intercompany | 5 | 4 | 3 | 3 | 2 | |
| Total sales volumes | ||||||
| Platinum | ('000oz) | 707.1 | 629.8 | 638.2 | 684.2 | 615.4 |
| Palladium | ('000oz) | 527.1 | 460.5 | 468.3 | 474.2 | 434.3 |
| Rhodium | ('000oz) | 94.4 | 82.5 | 94.1 | 87.1 | 79.6 |
| Nickel | (t) | 9 195 | 8 095 | 8 209 | 7 863 | 7 117 |
| Prices achieved | ||||||
| Platinum | (US$/oz) | 1 427 | 1 532 | 1 634 | 1 691 | 1 432 |
| Palladium | (US$/oz) | 742 | 659 | 689 | 655 | 374 |
| Rhodium | (US$/oz) | 982 | 1 099 | 1 549 | 2 254 | 2 065 |
| Nickel | (US$/t) | 14 702 | 16 314 | 19 723 | 23 757 | 19 031 |
| Exchange rate achieved | (R/US$) | 10.30 | 8.79 | 7.65 | 7.00 | 7.56 |
| Refined production | ||||||
| Platinum | ('000oz) | 767.0 | 872.3 | 697.5 | 895.1 | 870.1 |
| Palladium | ('000oz) | 513.0 | 669.8 | 541.1 | 680.6 | 778.7 |
| Rhodium | ('000oz) | 107.3 | 118.4 | 111.1 | 134.8 | 130.5 |
| Nickel | (t) | 11 939 | 11 983 | 10 582 | 10 829 | 10 314 |
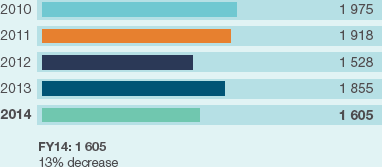
| PGM refined production | ('000oz) | 1 604.5 | 1 854.9 | 1 527.9 | 1 918.2 | 1 974.7 |
| Metal returned | ||||||
| Platinum | ('000oz) | 94.5 | 188.6 | 120.7 | 219.5 | 233.0 |
| Palladium | ('000oz) | 28.2 | 190.0 | 147.5 | 210.0 | 259.3 |
| Rhodium | ('000oz) | 9.0 | 35.5 | 24.8 | 41.7 | 49.3 |
| Nickel | (t) | 3 186 | 3 193 | 3 093 | 3 370 | 2 792 |
| * | Adjustments on metal prices and exchange rates have been reallocated to gross profit from other income and expense and foreign exchange profit or loss respectively in the statement of comprehensive income. | ||||||