Integrated
 Mineral resource
 Sustainable
 Implats Annual


Overview
Attributable mineral resources and mineral reserves
Summary of attributable mineral reserves
| Moz Pt | |||||
| 2012 | 2013 | 2014 | 2015 | ||
| Impala | 20.8 | 19.8 | 19.8 | 19.2 | |
| Marula | 1.1 | 1.1 | 1.1 | 1.2 | |
| Two Rivers | 0.8 | 0.9 | 0.8 | 1.1 | |
| Zimplats | 10.5 | 10.8 | 6.2 | 3.9 | |
| Mimosa | 0.8 | 0.7 | 0.6 | 1.0 | |
| Total | 34.1 | 33.3 | 28.4 | 26.4 | |
Notes
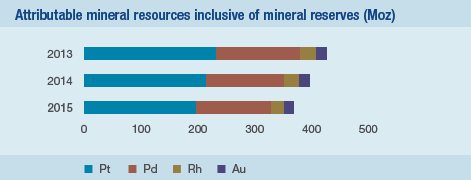
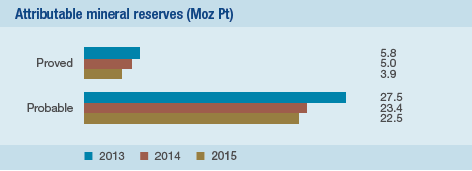
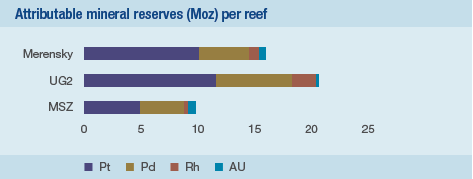
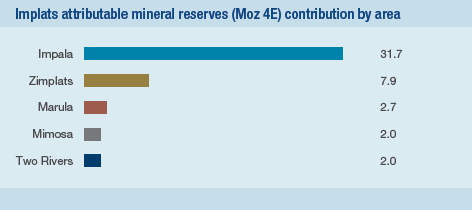
Implats reported attributable mineral reserves of some 26.4Moz Pt at 30 June 2015 compared to 28.4Moz Pt in 2014. The decrease can mostly be ascribed to changes in the Zimplats statement and depletion, however, this is offset to some extent by increases at Mimosa, Marula and Two Rivers. The attendant graphs compare the last few reporting periods and indicate an overall decrease in attributable mineral reserves in line with depletion and the aforementioned changes. The quantum of proved Merensky Reef mineral reserves at Impala remains lower than the same for the UG2 Reef. The Government of Zimbabwe has been pursuing the greater participation in the mining sector by indigenous Zimbabweans. Implats is continuing to engage with the Government of Zimbabwe with respect to agreeing plans for the indigenisation of Zimplats and Mimosa. The current position with regards to the implementation of the Government of Zimbabwe’s indigenisation plans is not clear and depending on what position is ultimately taken by the Government of Zimbabwe, Implats’ attributable mineral resources and mineral reserves may be significantly reduced. |