
 Integrated
 Mineral resource
 Sustainable
 Implats Annual


“The Mineral Corporation completed a technical review of Marula, they did not identify any fatal flaws in geological data collection and processing as well as mineral resources estimation

Mineral rights Marula

Marula locality map

The Marula mining operation is located on the eastern limb of the Bushveld Complex, some 35km north-west of Burgersfort. The operation is located between the Modikwa Mine, which is an Anglo Platinum/ARM Joint Venture, and the Anglo Platinum Twickenham Mine.
Platinum was first discovered in the area by renowned explorer Hans Merensky on the nearby farm Maandagshoek (now part of Modikwa Platinum Mine) in the 1920s. In June 1998 Implats entered into an arrangement to acquire the Winnaarshoek property from Platexco, a Canadian-based company. The mineral rights to portions of the adjacent farms of Clapham and Forest Hill and a sub-lease to Driekop were subsequently acquired from Anglo Platinum in exchange for Hendriksplaats (now part of Modikwa) so consolidating the Marula Mine area. The exploration programme was then expanded and some 750 surface boreholes were drilled. The establishment and development of the mine, requiring considerable investment from Implats in both infrastructure and environmental protection measures, commenced in October 2002.
Marula holds two contiguous mining rights and a prospecting right covering 5 494ha across the farms Winnaarshoek and Clapham, and portions of the farms Driekop, Forest Hill and Hackney. Marula also has a royalty agreement with Modikwa which allows limited mining on an area adjacent to the Driekop Shaft. These mineral resources and mineral reserves have not been reflected in the current statement as ownership still rests with Modikwa. During the past year an additional portion of the UG2 mineral rights on a portion of the farm Driekop has been incorporated into the Marula mining rights. Implats has a 73% interest in Marula with each of the three empowerment groupings (Mmakau Mining, the Marula Community Trust and Tubatse Platinum) holding a 9% interest.
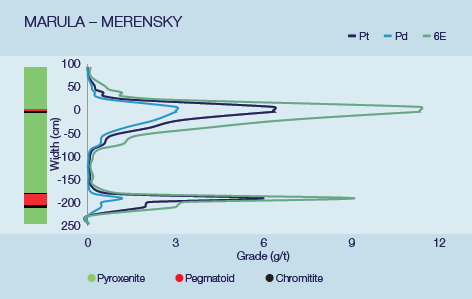
Both the Merensky and UG2 Reefs are present but only the UG2 is currently exploited. The geological succession is broadly similar to that of the western limb. The UG2 Reef is defined as a main chromitite layer, with most of the mineralisation confined to this unit, followed by a poorly mineralised pegmatoidal footwall. The Merensky Reef is the upper portion of a pyroxenite layer, with a chromitite stringer close to the hangingwall contact. Mineralisation peaks over the chromitite stringer and decreases into the hangingwall and footwall. Both mineralised horizons sub-outcrop on the Marula mining rights area and dip in a west-southwest direction at 12° to 14°. The vertical separation between the Merensky and UG2 Reefs averages 400m. The reefs are relatively undisturbed by faults and dykes with one major dyke traversing the mining area. Potholes represent the majority of the geological losses encountered underground, while a small dunite pipe also disrupts the reef horizons. These geological features are accounted for in the mineral resource and mineral reserve statements as geological losses.
Marula Mine has two decline shaft systems. Driekop Shaft is exploiting the UG2 Reef by means of a hybrid mining method, while at Clapham Shaft, both a hybrid and conventional mining method are currently being used to exploit the UG2 Reef. For the two hybrid sections, all main development is done on reef, and the stoping is carried out through conventional single-sided breast mining from a centre gully. Panel face lengths are approximately 16 to 24m, with panels being separated by 6m x 4m grid pillars with 2m ventilation holings. The stoping width averages 1.4m. For the conventional operation, the footwall drives are developed on strike approximately 25m below the reef horizon with cross-cut breakaways about 220m apart. This development is undertaken with drill rigs and dump trucks. Stope face drilling takes place with hand-held pneumatic rock drills with air legs.
Mine design and scheduling of the operational shafts is carried out utilising CadsMine™ software. Geological models and ore blocks are updated and validated using G-Blocks and boundaries in the MRM information system. Grade block models are developed utilising Isatis™ software. The planning process commences with the compilation of the LoM plan (August to October) followed by a detailed two-year budget plan (March to May).
The spread of mineral reserves over the three mining sections is depicted here. The majority of the mineral reserves (67%) is located in the Clapham decline section. The LoM I encompasses the UG2 Reef Clapham hybrid, Clapham up to 5 Level, Driekop hybrid and Driekop Extension areas. This will take the mine to a sustainable production level of over 2Mt per annum until 2024. Maintaining the profile after 2024 is the subject of ongoing studies and will require some capital expenditure to optimise the LoM II and LoM III in the 30-year LoM profile. The comparison between the mineral resource statement and the 30-year LoM profile clearly illustrates its potential to expand operations in future if economically viable. Note that the indicative LoM profile is based on a range of assumptions which could change in future. Marula has a concentrator plant where initial processing is conducted. Concentrate is transported by road to Impala’s Mineral Processes in Rustenburg in terms of a LoM offtake agreement with Impala Refining Services (IRS). |


The historic operating statistics for Marula are shown below:
Key operating statistics
| 2015 | 2014 | 2013 | 2012 | 2011 | ||
| Production | ||||||
| Tonnes milled ex mine | (000t) | 1 662 | 1 794 | 1 628 | 1 579 | 1 542 |
| Head grade 6E | (g/t) | 4.19 | 4.19 | 4.19 | 4.18 | 4.39 |
| Platinum in concentrate | (000 oz) | 73.6 | 78.5 | 71.7 | 69.1 | 70.6 |
| PGM in concentrate | (000 oz) | 193.3 | 206.4 | 188.3 | 182.2 | 185.7 |
| Breakdown of cash costs | ||||||
| On-mine operations | (Rm) | (1 469) | (1 371) | (1 249) | (984) | (1 040) |
| Concentrating operations | (Rm) | (193) | (188) | (161) | (155) | (152) |
| Total cost | (Rm) | 1 662 | 1 559 | 1 410 | 1 139 | 1 192 |
| Per tonne milled | (R/t) | 1 000 | 869 | 866 | 721 | 773 |
| ($/t) | 88 | 84 | 98 | 93 | 110 | |
| Per Pt oz in concentrate | (R/oz) | 22 582 | 19 860 | 19 665 | 16 483 | 16 884 |
| ($/oz) | 1 978 | 1 915 | 2 230 | 2 129 | 2 401 | |
| Financial ratios | ||||||
| Gross margin ex mine | (%) | (13.4) | (0.7) | (15.4) | (6.7) | (3.2) |
| Capital expenditure | (Rm) | 145 | 161 | 127 | 212 | 251 |
| ($m) | 13 | 16 | 14 | 27 | 36 |