
 Integrated
 Mineral resource
 Sustainable
 Implats Annual

Mineral Resources and Mineral Reserves
Marula

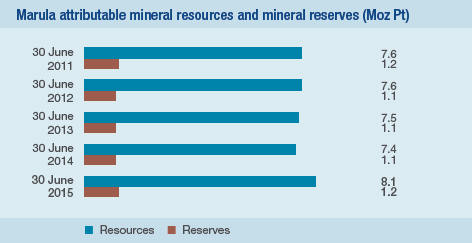
Marula mineral resources and mineral reserves (100%; inclusive reporting)
as at 30 June 2015
| Mineral resources | as at 30 June 2015 | as at 30 June 2014 | ||||||||||||||||
| Orebody | Category | Tonnes Mt |
Width cm |
4E grade g/t |
6E grade g/t |
Ni % |
Cu % |
4E Moz |
6E Moz |
Pt Moz |
Tonnes Mt |
Width cm |
4E grade g/t |
6E grade g/t |
4E Moz |
Pt Moz |
||
| Merensky | Measured | 34.3 | 100 | 4.24 | 4.55 | 0.20 | 0.11 | 4.7 | 5.0 | 2.7 | 34.3 | 100 | 4.24 | 4.55 | 4.7 | 2.7 | ||
| Indicated | 7.7 | 100 | 4.26 | 4.54 | 0.19 | 0.11 | 1.1 | 1.1 | 0.6 | 7.7 | 100 | 4.26 | 4.54 | 1.1 | 0.6 | |||
| Inferred | 9.9 | 100 | 4.16 | 4.46 | 0.21 | 0.12 | 1.3 | 1.4 | 0.8 | 9.9 | 100 | 4.16 | 4.46 | 1.3 | 0.8 | |||
| UG2 | Measured | 34.0 | 57 | 8.75 | 10.17 | 0.05 | 0.02 | 9.6 | 11.1 | 4.2 | 30.1 | 57 | 8.75 | 10.16 | 8.4 | 3.7 | ||
| Indicated | 14.2 | 62 | 8.92 | 10.38 | 0.06 | 0.03 | 4.1 | 4.7 | 1.8 | 12.4 | 62 | 8.90 | 10.33 | 3.5 | 1.6 | |||
| Inferred | 7.6 | 60 | 9.09 | 10.61 | 0.06 | 0.03 | 2.2 | 2.6 | 1.0 | 6.1 | 60 | 9.07 | 10.57 | 1.8 | 0.8 | |||
| Total | 107.7 | 6.62 | 7.51 | 0.13 | 0.07 | 22.9 | 26.0 | 11.1 | 100.4 | 6.45 | 7.30 | 20.8 | 10.1 | |||||
| Mineral reserves | as at 30 June 2015 | as at 30 June 2014 | ||||||||||||||
| Orebody | Category | Tonnes Mt |
Width cm |
4E grade g/t |
6E grade g/t |
4E Moz |
6E Moz |
Pt Moz |
Tonnes Mt |
Width cm |
4E grade g/t |
6E grade g/t |
4E Moz |
Pt Moz |
||
| UG2 | Proved | 3.0 | 136 | 4.02 | 4.67 | 0.4 | 0.4 | 0.2 | 3.1 | 136 | 4.04 | 4.69 | 0.4 | 0.2 | ||
| Probable | 27.0 | 134 | 3.85 | 4.47 | 3.3 | 3.9 | 1.5 | 22.0 | 137 | 4.15 | 4.81 | 2.9 | 1.3 | |||
| Total | 30.0 | 3.87 | 4.49 | 3.7 | 4.3 | 1.6 | 25.1 | 4.14 | 4.80 | 3.3 | 1.5 | |||||
Comparison between mineral resource estimate for UG2 chromitite layer and the estimate for the UG2 minimum mining width
as at 30 June 2015
| Mineral resources | Minimum mining width as at 30 June 2015 | UG2 chromitite layer as at 30 June 2015 | |||||||||||||||||
| Orebody | Category | Tonnes Mt |
Width cm |
4E grade g/t |
6E grade g/t |
Ni % |
Cu % |
4E Moz |
6E Moz |
Pt Moz |
Tonnes Mt |
Width cm |
4E grade g/t |
6E grade g/t |
4E Moz |
6E Moz |
Pt Moz |
||
| UG2 | Measured | 53.2 | 96 | 6.19 | 7.18 | 0.04 | 0.02 | 10.6 | 12.3 | 4.6 | 34.0 | 57 | 8.75 | 10.17 | 9.6 | 11.1 | 4.2 | ||
| Indicated | 22.0 | 102 | 6.25 | 7.25 | 0.05 | 0.02 | 4.4 | 5.1 | 1.9 | 14.2 | 62 | 8.92 | 10.38 | 4.1 | 4.7 | 1.8 | |||
| Inferred | 11.8 | 99 | 6.48 | 7.51 | 0.05 | 0.02 | 2.5 | 2.9 | 1.1 | 7.6 | 60 | 9.09 | 10.61 | 2.2 | 2.6 | 1.0 | |||
| Total | 87.0 | 6.24 | 7.24 | 0.05 | 0.02 | 17.5 | 20.2 | 7.7 | 55.8 | 8.84 | 10.28 | 15.9 | 18.5 | 7.0 | |||||
Relationship between exploration results, mineral resources and mineral reserves (100%)

Notes
- The statement reflects total estimates for Marula as at 30 June 2015; corresponding estimated attributable mineral resources and reserves are summarised elsewhere in this report
- Mineral resources are quoted inclusive of mineral reserves
- Mineral reserves quoted now reflect the stoping width, and not a total mine width
- Mineral reserves quoted reflect the grade delivered to the mill rather than the in situ channel grade quoted in respect of the mineral resources
- The modifying factors used in the UG2 mineral reserve calculation are based on the mine plan which envisages hybrid and conventional breast mining operations
- Estimated geological losses have been accounted for in the mineral re source calculation
- The UG2 mineral resource accounts for the main chromitite layer channel width only, without consideration of dilution. A separate table is included this year to reflect the comparative minimum mining width resource cut. Notably this shows a lower grade but with similar metal content
- Grade estimates were obtained by means of ordinary kriging of borehole intersections
- No additional work was done on the Merensky mineral resource estimation during the year and the same statement is reported as in the previous three years
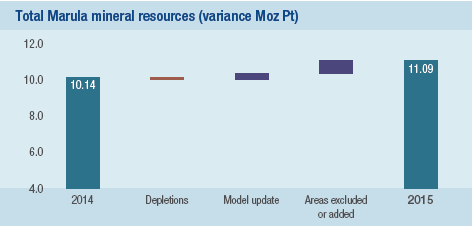
- Changes in the UG2 mineral resource estimates since last year reflect an updated estimation using limited additional data
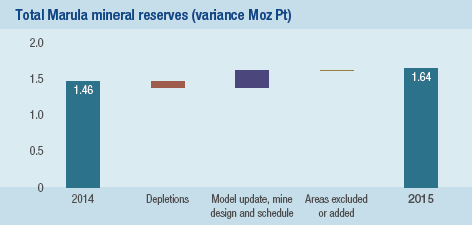
- No inferred mineral resources have been converted into mineral reserves
- The mineral resources and mineral reserves are reflected in both 4E and 6E formats
- Rounding of numbers may result in minor computational discrepancies. Mineral resource estimates are inherently imprecise in nature and the results tabulated in this report must be read as estimates and not as calculations; inferred mineral resources in particular are qualified as approximations
- The average nickel and copper grades based on exploration samples are 0.202% Ni and 0.115% Cu for the Merensky Reef channel
- The average nickel and copper grades based on exploration samples are 0.056% Ni and 0.025% Cu for the UG2 Reef channel
- The economic viability of the Marula mineral reserves is tested by means of net present value calculations over the LoM of the reserve, determining the lowest real rand basket price which would still render the reserve viable. This is then tested against the internal Marula estimate of the real long-term basket price, the spot price as at 30 June 2015 and a consensus view from various financial institutions. These tests indicate that the Marula operation requires a real long-term basket price of between R23 500 to R24 500 to be economically viable. While the real spot basket price as at 30 June 2015 was R24 618, the Marula internal long-term real basket price is R33 436 and the equivalent calculated consensus price is R28 048
|

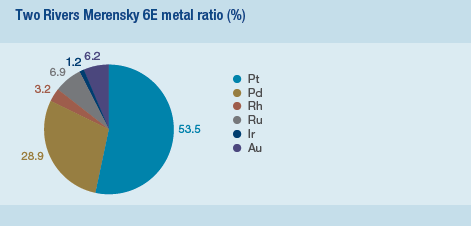

Marula Merensky resources
Marula UG2 mineral resources and mineral reserves
|


The year-on-year reconciliation of the total Marula mineral resources and mineral reserves is depicted in the accompanying graphs.
  |