
 Integrated
 Mineral resource
 Sustainable
 Implats Annual


Zimplats’ Ngezi mine is located approximately 150km south-west of Harare. The mine lies on a geological feature known as the Great Dyke, a sinuous, layered, mafic-ultramafic intrusion running 550 kilometres along practically the full north-south axis of Zimbabwe and ranging in width from four to 11 kilometres. The 100 kilometre long Hartley Complex is the largest and most important segment of the Great Dyke, containing approximately 80% of Zimbabwe's total PGM resources.
In 1986 Delta Gold Limited (Delta) acquired rights to its first platinum resources on the Great Dyke. Delta brought BHP into a joint venture. In 1990 the mining company BHP, in partnership with Delta Gold (2/3 BHP and 1/3 Delta), began to develop the Hartley Complex and established a mine, complete with smelter, at Selous in 1994. However, following a string of geological and metallurgical problems, the mine never achieved the production targets set by BHP to make it profitable and underground operations were suspended in June 1999, the mine was then put on care and maintenance. The dormant Hartley Mine and the Selous Metallurgical Complex (SMC) are located 77km north of the Ngezi Mine in the Darwendale sub-chamber.
In 1998, Delta demerged its platinum interests into a special purpose vehicle; Zimplats. In May 1999 the company purchased BHP's interests in Hartley Platinum and the Mhondoro Platinum Joint Ventures which included a concentrator and smelter and extended its cover to include interests in all the platinum resources of the Hartley Complex. In early 2001, Zimplats announced the development of Ngezi into a 2.2Mt/y open pit operation producing 208 000oz/y of PGMs, plus nickel, copper and cobalt, following the acquisition of a share of the project by Implats and the South African bank Absa. Zimplats commenced production at the Ngezi opencast mine in December 2001 and the first converter matte was exported in April 2002.
Over the next two years, Implats progressively increased its shareholding in Zimplats until 2003 when it made an unconditional cash offer to minority shareholders in Zimplats. Implats currently holds 87% of Zimplats. Zimplats started to develop underground operations at Ngezi in 2003. These replaced the open pit production in 2008 and have been expanded to the current 6.2 million tonne per year operation with four portals, an open-pit and two new concentrator modules at Ngezi.
The Zimbabwean Government has been pursuing the greater participation in the mining sector by indigenous Zimbabweans. Implats is continuing to engage with the Government of Zimbabwe with respect to agreeing plans for the indigenisation of Zimplats. The current position with regards to the implementation of the Government of Zimbabwe’s indigenisation plans is not clear and depending on what position is ultimately taken by the Government of Zimbabwe, Implats’ attributable mineral resources and ore reserves may be significantly reduced. During 2013, the Government of Zimbabwe gazetted its intention to compulsorily acquire a large tract of ground in the northern portion of the Zimplats lease containing 54.6Moz Pt; Zimplats subsequently submitted an objection to this notice.
The platinum-bearing Main Sulphide Zone (MSZ) is located in the P1 pyroxenite some 10m to 50m below the ultramafic/mafic contact. The MSZ is a continuous layer, 2m to 10m thick, and forms an elongated basin. The zone strikes in a north-northeasterly trend and dips between 5° and 20° on the margins flattening towards the axis of the basin. Peak base metal and PGM values are offset vertically with palladium peaking at the base, platinum in the centre and nickel towards the top. Visual identification of the MSZ is difficult, therefore systematic monitoring supported by channel sampling is needed to guide mining.


Production is presently sourced from four decline shafts or portals and one open-pit. Boundaries between individual portals are usually based on major faults. Minor faults and other disrupted areas are present and are taken into account in the mineral resources and ore reserves statements as geological losses. No potholes, as found in the South African operations, have been identified.
Zimplats employs mechanised room and pillar mining to extract ore from stopes with a nominal width of 2.5m at dips of less than 9°. Each production team consists of 20 to 30 rooms and the total length is dependent on the sizes (widths) of the pillars and rooms. In general, the declines are centralised in each resource area and any asymmetry is accounted for in the mine production scheduling. This allows sufficient flexibility for the required grade control sampling and to negotiate faults and intrusions while still achieving the team’s production targets. Each production team deploys a single boom face rig for drilling, a roof bolter for support drilling, a 10t load and dump (LHD) and a 30t dump truck. The broken rock is trucked to surface at Portals 1 and 2 while, at Portals 3 and 4, the broken rock is trucked on the reef horizon by 30t dump trucks to a central ore-pass/crushing facility where it is crushed and conveyed to surface using the footwall decline conveyor.
The production target for each fleet ranges from 17 500t to 20 000t of ore per month depending on the particular mine, mine design and the pillar layout. The default layout has 7m panels with 5m square pillars. However, spans may decrease and pillar dimensions may increase in bad ground and in deeper sections of the mine. A combination of roof bolts and tendons is integral to the support design.
During the year under review, there was a failure of a large proportion of the support pillars at Bimha Mine, which necessitated a revision of the geotechnical and mine design parameters for the Bimha and Mupfuti Mines. A low angle shear in the deeper sections of Bimha Mine, which had a deleterious effect on pillar strength contributed to this collapse. Investigative and recovery work included revision of geotechnical parameters on the mine design and resulted in the modification of pillar layouts, revised mine designs and a reduction in extraction factors for these portals. A decision was made to temporarily close the Bimha Mine to ensure the safety of employees. As a result of the collapse and subsequent temporary precautionary closure of the mine, the affected production teams from Bimha were redeployed to the other three underground mines in an effort to regain lost production. Further reduction to loss of production was achieved by commencing mining operations at the Ngezi South Open-pit during the second quarter of the year. Production from the open pit and the redeployment of production teams, reduced the ore supply gap and managed to deliver the full monthly mill target by the fourth quarter.
A total combined production of 6.2Mt per annum will be sustainable at the operations from 2016 until at least 2042. Portals 1 to 4 including the open pit constitute LoM I and portals 5 to 7 LoM II. LoM III is made up of future mining from Portal 8. The potential growth beyond the 6.2Mt profile is dependent on a range of technical, economic and political considerations. The LoM profile shown below is based on assumptions and may change in future. The distribution of the ore reserves across the portals is depicted in the accompanying graph.
Relationship between exploration results, mineral resources and ore reserves (100%; inclusive reporting)

Key operating statistics
| 2015 | 2014 | 2013 | 2012 | 2011 | ||
| Production | ||||||
| Tonnes milled ex mine | (000t) | 5 164 | 5 939 | 4 683 | 4 393 | 4 223 |
| Head grade 6E | (g/t) | 3.47 | 3.47 | 3.53 | 3.53 | 3.56 |
| Platinum in matte | (000 oz) | 190.0 | 239.7 | 198.1 | 187.1 | 182.1 |
| PGM in matte | (000 oz) | 406.0 | 515.8 | 416.2 | 396.4 | 388.8 |
| Breakdown of cash costs | ||||||
| On-mine operations | (Rm) | (2 196) | (1 942) | (1 434) | (1 089) | (870) |
| Processing operations | (Rm) | (1 107) | (1 047) | (627) | (494) | (446) |
| Selling and administration | (Rm) | (347) | (219) | (222) | (212) | (183) |
| Total cost | (Rm) | 3 650 | 3 208 | 2 283 | 1 795 | 1 499 |
| Per tonne milled | (R/t) | 707 | 540 | 487 | 409 | 355 |
| ($/oz) | 62 | 52 | 55 | 53 | 50 | |
| Per Pt oz in matte | (R/oz) | 19 211 | 13 383 | 11 524 | 9 594 | 8 232 |
| ($/oz) | 1 683 | 1 291 | 1 307 | 1 239 | 1 171 | |
| Financial ratios | ||||||
| Gross margin ex mine | (%) | 10.3 | 34.1 | 34.9 | 43.4 | 52.0 |
| Capital expenditure | (Rm) | 968 | 1 166 | 1 381 | 2 104 | 839 |
| ($m) | 85 | 112 | 157 | 272 | 119 |

Zimplats built two concentrators at Ngezi which were commissioned in 2009 and 2013. Approximately one-third of the mine output is also transported by road trains to the concentrator at SMC. Concentrate from both Ngezi plants and SMC is then smelted in an arc furnace and converted to matte at SMC. The resulting matte is despatched to Impala’s refinery in Springs (after blending in Rustenburg) under the terms of a LoM agreement with IRS.
Zimplats mineral resources and ore reserves (100%; inclusive reporting)
as at 30 June 2015
| Mineral resources | as at 30 June 2015 | as at 30 June 2014 | |||||||||||||||||
| Orebody | Category | Tonnes Mt |
Width cm |
4E grade g/t |
6E grade g/t |
Ni % |
Cu % |
4E Moz |
6E Moz |
Pt Moz |
Tonnes Mt |
Width cm |
4E grade g/t |
6E grade g/t |
Ni % |
Cu % |
4E Moz |
Pt Moz |
|
| Ngezi Portals – Advanced to reserve |
|||||||||||||||||||
| MSZ | Measured | 53.6 | 250 | 3.46 | 3.64 | 0.10 | 0.07 | 6.0 | 6.3 | 3.0 | 63.9 | 250 | 3.46 | 3.65 | 0.10 | 0.08 | 7.1 | 3.5 | |
| Indicated | 50.1 | 250 | 3.43 | 3.61 | 0.10 | 0.08 | 5.5 | 5.8 | 2.8 | 96.0 | 250 | 3.54 | 3.74 | 0.10 | 0.08 | 10.9 | 5.5 | ||
| Total | 103.7 | 3.45 | 3.63 | 0.10 | 0.07 | 11.5 | 12.1 | 5.8 | 159.9 | 3.51 | 3.70 | 0.10 | 0.08 | 18.1 | 9.1 | ||||
| Ngezi Portals – Not advanced to reserve |
|||||||||||||||||||
| MSZ | Measured | 95.4 | 250 | 3.27 | 3.45 | 0.11 | 0.08 | 10.0 | 10.6 | 4.9 | 80.8 | 250 | 3.29 | 3.47 | 0.10 | 0.08 | 8.5 | 4.2 | |
| Indicated | 404.8 | 239 | 3.34 | 3.52 | 0.11 | 0.08 | 43.5 | 45.9 | 21.6 | 341.9 | 234 | 3.41 | 3.59 | 0.12 | 0.09 | 37.4 | 18.4 | ||
| Inferred | 72.3 | 200 | 3.25 | 3.41 | 0.12 | 0.08 | 7.5 | 7.9 | 4.1 | 99.6 | 200 | 3.42 | 3.61 | 0.12 | 0.08 | 10.9 | 5.7 | ||
| Total | 572.4 | 3.32 | 3.50 | 0.11 | 0.08 | 61.1 | 64.4 | 30.5 | 522.3 | 3.39 | 3.58 | 0.12 | 0.08 | 57.0 | 28.4 | ||||
| Mining lease north of Portal 10* | |||||||||||||||||||
| MSZ | Indicated | 70.0 | 192 | 3.44 | 3.70 | 0.20 | 0.18 | 7.7 | 8.3 | 3.4 | 70.0 | 192 | 3.44 | 3.70 | 0.20 | 0.18 | 7.7 | 3.4 | |
| Inferred | 1 021.0 | 239 | 3.22 | 3.50 | 0.12 | 0.09 | 105.7 | 114.9 | 50.2 | 1 021.0 | 239 | 3.22 | 3.50 | 0.12 | 0.09 | 105.7 | 50.2 | ||
| Total | 1 091.0 | 3.23 | 3.51 | 0.13 | 0.10 | 113.4 | 123.2 | 53.6 | 1 091.0 | 3.23 | 3.51 | 0.13 | 0.10 | 113.4 | 53.6 | ||||
| Hartley | |||||||||||||||||||
| MSZ | Measured | 28.3 | 158 | 4.53 | 4.78 | 0.14 | 0.12 | 4.1 | 4.3 | 2.0 | 28.3 | 158 | 4.53 | 4.78 | 0.14 | 0.12 | 4.1 | 2.0 | |
| Indicated | 143.1 | 189 | 3.97 | 4.19 | 0.13 | 0.11 | 18.3 | 19.3 | 9.3 | 143.1 | 189 | 3.97 | 4.19 | 0.13 | 0.11 | 18.3 | 9.3 | ||
| Inferred | 46.3 | 191 | 3.89 | 4.10 | 0.13 | 0.10 | 5.8 | 6.1 | 3.0 | 46.3 | 191 | 3.89 | 4.10 | 0.13 | 0.10 | 5.8 | 3.0 | ||
| Total | 217.7 | 4.03 | 4.25 | 0.13 | 0.11 | 28.2 | 29.7 | 14.2 | 217.7 | 4.03 | 4.25 | 0.13 | 0.11 | 28.2 | 14.2 | ||||
| Oxides – all areas | |||||||||||||||||||
| MSZ | Indicated | 16.2 | 250 | 3.42 | 3.61 | 0.10 | 0.07 | 1.8 | 1.9 | 0.9 | 16.2 | 250 | 3.42 | 3.61 | 0.10 | 0.07 | 1.8 | 0.9 | |
| Inferred | 38.3 | 217 | 3.56 | 3.76 | 0.12 | 0.10 | 4.4 | 4.6 | 2.2 | 38.3 | 217 | 3.56 | 3.76 | 0.12 | 0.10 | 4.4 | 2.2 | ||
| Inferred north of Portal 10 | 21.0 | 239 | 3.17 | 3.44 | 0.12 | 0.10 | 2.1 | 2.3 | 1.0 | 21.0 | 239 | 3.17 | 3.44 | 0.12 | 0.10 | 2.1 | 1.0 | ||
| Total | 75.6 | 3.42 | 3.64 | 0.11 | 0.09 | 8.3 | 8.8 | 4.1 | 75.6 | 3.42 | 3.64 | 0.11 | 0.09 | 8.3 | 4.1 | ||||
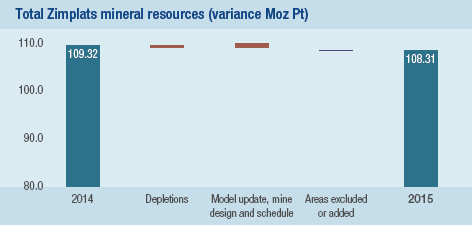
| Overall | Total | 2 060.4 | 3.36 | 3.60 | 0.12 | 0.09 | 222.5 | 238.3 | 108.3 | 2 066.4 | 3.39 | 3.63 | 0.12 | 0.09 | 224.9 | 109.3 | |||
| Ore reserves | as at 30 June 2015 | as at 30 June 2014 | |||||||||||||||||
| Orebody | Category | Tonnes Mt |
Width cm |
4E grade g/t |
6E grade g/t |
Ni % |
Cu % |
4E Moz |
6E Moz |
Pt Moz |
Tonnes Mt |
Width cm |
4E grade g/t |
6E grade g/t |
Ni % |
Cu % |
4E Moz |
Pt Moz |
|
| MSZ | Proved | 21.0 | 274 | 3.31 | 3.50 | 0.09 | 0.06 | 2.2 | 2.4 | 1.1 | 54.9 | 274 | 3.35 | 3.54 | 0.10 | 0.07 | 5.9 | 2.9 | |
| Probable | 62.6 | 275 | 3.37 | 3.56 | 0.10 | 0.07 | 6.8 | 7.2 | 3.4 | 77.9 | 273 | 3.39 | 3.58 | 0.10 | 0.07 | 8.5 | 4.2 | ||
| Total | 83.7 | 3.36 | 3.54 | 0.10 | 0.07 | 9.0 | 9.5 | 4.5 | 132.8 | 3.37 | 3.56 | 0.10 | 0.07 | 14.4 | 7.1 | ||||
* Mining lease north of Portal 10 essentially coincides with the area previously gazetted by the Zimbabwean government for compulsory acquisition.
Notes
- The statement on the previous page reflects the total mineral resource and ore reserve estimate for Zimplats as at 30 June 2015. Corresponding estimated mineral resources and ore reserves attributable to Implats are summarised elsewhere in this report
- Zimplats’ standard is to report mineral resources inclusive of ore reserves
- The ore reserves figures are estimated based on the diluted grades delivered to the processing plants
- Day-to-day operations are monitored using in-house lead collector fire assays with AA finish. The mineral resources and ore reserves in this statement are based largely on Genalysis nickel sulphide collector fire assays with ICP-MS finish. The differences between the methods are incorporated within the modifying factors that have been applied, which mean that there may be slight distortions in recovery and other parameters
- Resources have been estimated using kriging techniques on data derived from surface exploration drill holes. Estimates are based on composite widths that vary depending on cut-off grades, which are based on appropriate economic conditions
- The boundaries of the ore envelope are gradational, particularly in the footwall, so the choice of mining cut is affected by economic factors. The price of the suite of metals that is produced from the MSZ has fluctuated considerably in the last few years. It is, however, believed that the choice of mining cut is robust under a wide range of pricing conditions
- Estimates are produced in accordance with Implats’ group-wide protocol for the estimation, classification and reporting of mineral reserves and mineral resources. The objectives of the code are to improve standardisation, consistency and to facilitate auditing
- Although these estimates are reported according to JORC (2012) this is an annual update incorporating some new drilling, depletions and the current view on modifying factors, which are a development of previous estimates prepared under JORC (2004)
- The maximum depth of these resources is 1 250m and no part is more than 5km down dip from outcrop
- Zimplats’ mineral resources are held under Special Mining Lease 1, the first 25-year period of which expires in 2019. The agreement allows for two extensions of 10 years each
- The mineral resources and ore reserves estimates tabulated in this report are estimates and not calculations. They are subject to a wide range of factors, some of which are outside the company’s control, which include:
- The quality and quantity of available data. Estimates are based on limited sampling and, consequently, there is uncertainty as the samples may not be representative of the entire ore body and mineral resources.
- The quality of the methodologies employed.
- Economic conditions and commodity prices.
- No inferred mineral resources have been converted into ore reserves
- Geological interpretation and the judgement of the individuals’ involved. Changes in these factors along with developments in the understanding of the ore body and changes in recovery rates, production costs and other factors may ultimately result in a restatement of ore reserves and/or mineral resources and may adversely impact future cash flows
- To mitigate this risk the company appoints independent third parties to review the mineral resources and ore reserves estimates on a regular basis and mining project feasibilities studies are subject to independent review prior to applying to the board for capital approval
- The Mineral Corporation completed an audit of the current estimates and concluded that there were no key issues identified with respect to the mineral resources or ore reserves estimates
- Rounding-off of numbers may result in minor computational discrepancies
- The economic viability of the Zimplats ore reserves is tested by means of net present value calculations over the LoM of the reserve, determining the lowest real rand basket price which would still render the reserve viable. This is then tested against the internal Zimplats estimate of the real long-term basket price, the spot price as at 30 June 2015 and a consensus view from various financial institutions. These tests indicate that the Zimplats operation requires a real long-term basket price of between R22 000 to R23 000 to be economically viable. While the real spot basket price as at 30 June 2015 was R22 285, the Zimplats internal long-term real basket price is R29 066 and the equivalent calculated consensus price is R25 278.

The year-on-year reconciliation of the total Zimplats mineral resources and mineral reserves is depicted in the accompanying graphs.
|
|


Zimplats MSZ mineral resources and ore reserves
